

Introduction
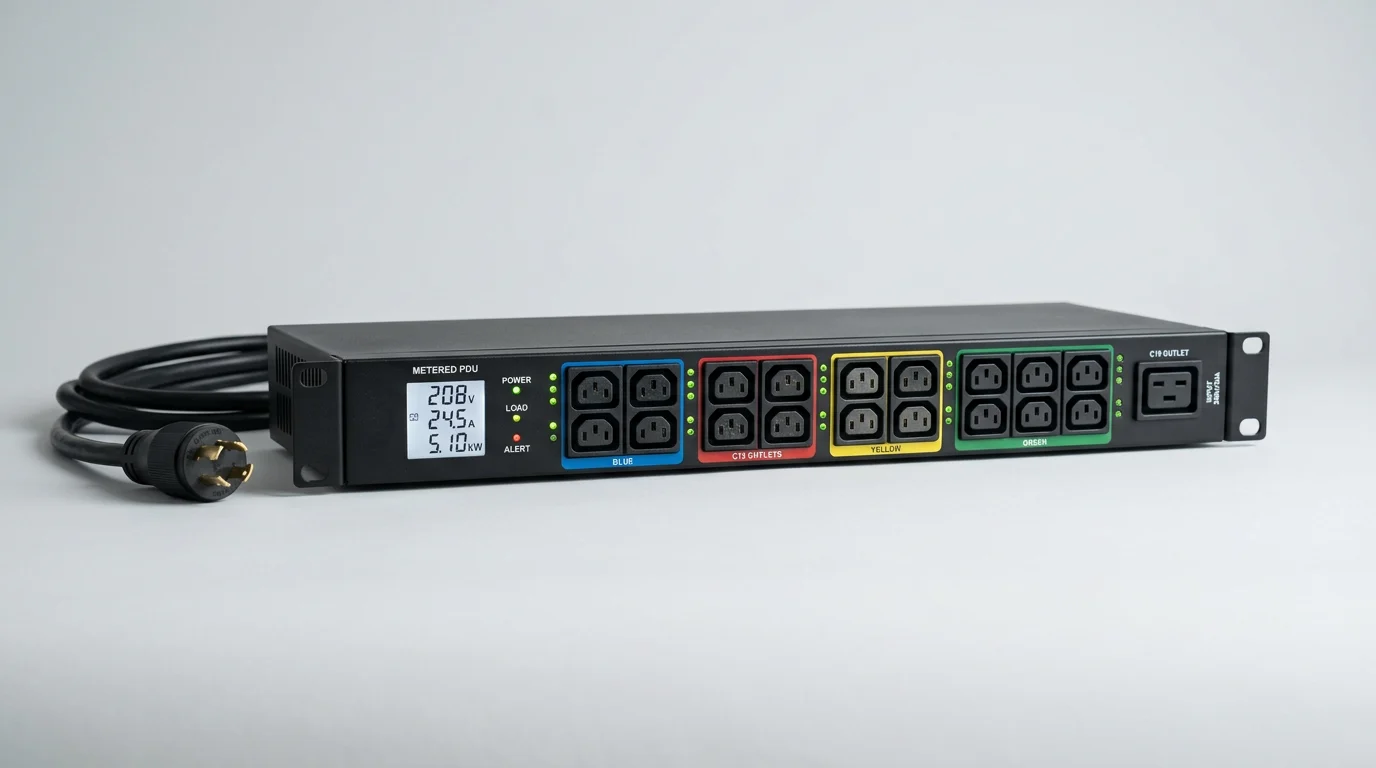
In rack-level power management, small visibility gaps often lead to costly mistakes. A metered PDU with a local digital indicator gives technicians immediate, on-site confirmation of current load, making it easier to judge available capacity before adding or moving equipment. That simple readout can prevent overloaded circuits, reduce hesitation during installs, and cut reliance on remote tools when hands-on decisions must be made quickly. This article explains how local load visibility improves day-to-day accuracy, why it matters in live data center environments, and how it helps reduce avoidable human error during routine power changes.
Why Local Digital Indicators on Metered PDUs Matter
I cannot count how many times I have walked into a data center and seen a technician sweating over a perfectly good rack, terrified to plug in one more server. When managing mission-critical infrastructure, flying blind on power consumption is a recipe for tripped breakers and catastrophic downtime. That is exactly why having a Metered PDU with a bright, clear screen right at the rack level has become a non-negotiable standard for modern deployments.
We often talk about remote monitoring software, but the reality on the floor is that hands-on work requires hands-on visibility. When a technician is physically racking a 2U server, they are not always looking at a tablet or calling the NOC to check capacity. They need immediate, localized data to make safe decisions.
Business case for local load visibility
Let’s examine the business case for local load visibility. Industry studies consistently show that data center downtime can cost upwards of $9,000 per minute. A significant portion of these outages stems from simple, preventable human errors—like overloading a single branch circuit. Investing in a Digital Indicator directly on the power strip acts as an insurance policy against these mistakes.
Providing instant visual feedback allows IT staff to verify capacity before committing to a power draw. For example, if a standard 30A circuit is governed by the National Electrical Code’s 80% rule, it safely supports only a 24A continuous load. Expecting technicians to mentally track what is already plugged in or to cross-reference outdated spreadsheets introduces massive operational risk. A local screen eliminates this guesswork by showing exactly where the load stands against that 24A threshold.
Where human error occurs in rack power work
Where do these mistakes actually happen? The highest risk typically occurs during routine MACs (Moves, Adds, and Changes). A technician might plug a high-density blade chassis into the wrong phase of a 3-phase system, or they might stack too many dual-corded power supplies onto a primary circuit, leaving the redundant circuit underutilized.
Another common trap is the ‘cascading overload.’ If a primary breaker trips, it forces the entire rack’s load onto the secondary PDU. If that secondary unit is already running at 60% capacity, the sudden surge pushes it to 120%, tripping the backup and dropping the entire rack. Local indicators give teams the immediate visual cues needed to balance loads properly before a redundant failover is ever tested.
What a Local Digital Indicator on a Metered PDU Shows
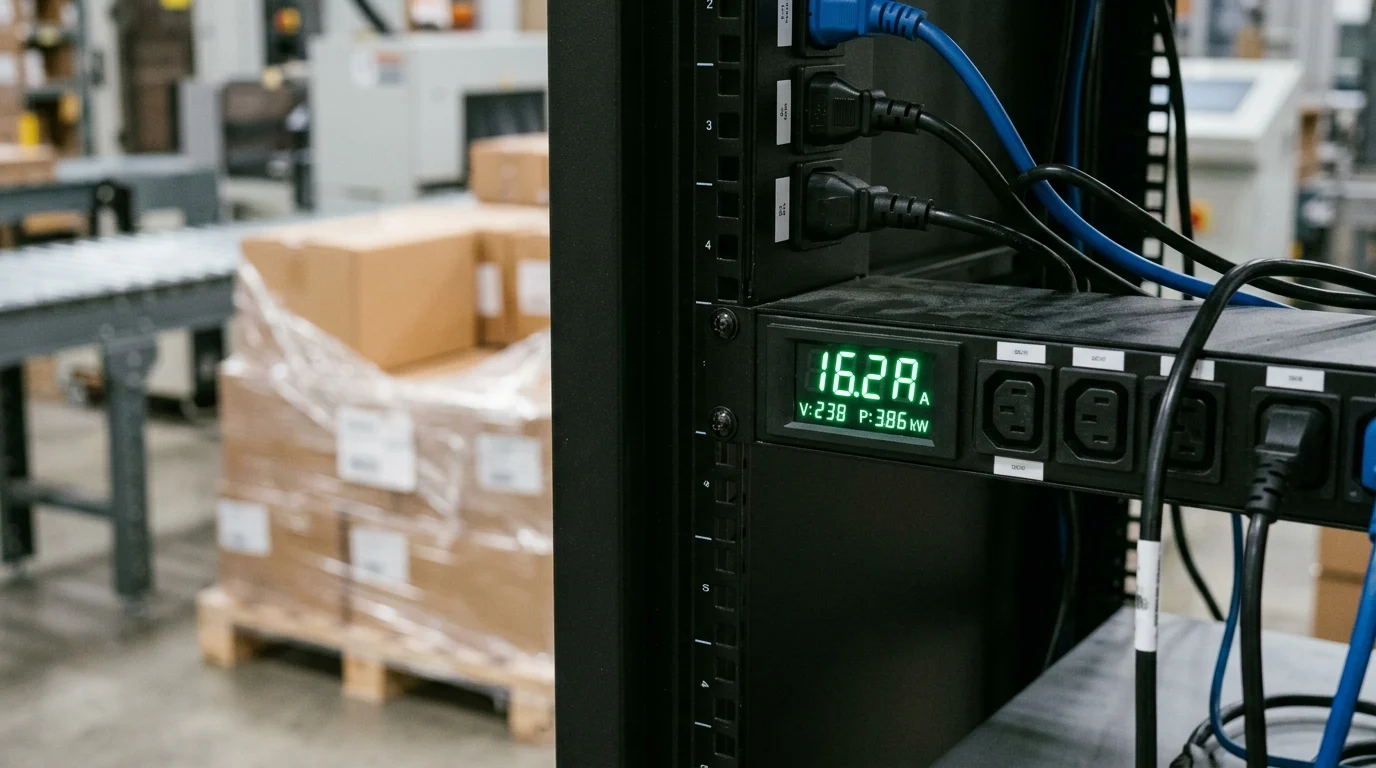
Looking at the interface of a modern rack power unit reveals much more than just a glowing red number. Today’s displays are sophisticated diagnostic tools designed to keep your Rack Power Supply stable and technicians informed.
Metered PDU vs basic PDU
The difference between a basic power strip and a metered unit comes down to data. A basic PDU is essentially an industrial extension cord: it distributes power but provides zero insight into what is flowing through it. If overloaded, the first and only warning is a tripped breaker.
| Feature | Basic PDU | Metered PDU (Local Display) |
|---|---|---|
| Load Visibility | None | Real-time Amps, Volts, kW |
| Overload Warning | Tripped Breaker | Visual Alarms (Color-changing LCD) |
| Phase Balancing | Guesswork | Precise per-phase data |
| Cost Profile | Lowest upfront | ~20-30% premium, high ROI |
As the table illustrates, upgrading to a metered unit changes the operational dynamic entirely. Facilities move from a reactive stance to a proactive one, allowing teams to catch potential issues before they cause an outage.
Electrical and usability specs that reduce mistakes
To genuinely reduce mistakes, the electrical and usability specifications of the display matter immensely. Units that offer ±1% billing-grade accuracy are ideal. If a screen tells a technician they are drawing 15.2 amps, they need to know that number is precise. Inaccurate readings breed distrust, eventually leading technicians to ignore the display altogether.
Usability specs are equally critical. High-contrast OLED or backlit LCD screens, typically around 1.8 to 2 inches diagonally, ensure readability even in dimly lit hot aisles. Furthermore, the data refresh rate should be rapid—usually updating every 1 to 3 seconds—so that the moment a server spins up its fans, the spike in inrush current is immediately captured and displayed.
Key differences in local indicator features
Not all local indicators are created equal, and their key differences dictate how useful they are during an emergency. Older or cheaper models might feature a static, single-line LED that only shows total amperage, requiring users to press a physical button repeatedly to cycle through different phases or branch circuits.
Modern units utilize auto-scrolling, multi-color displays. Screens that change color based on load thresholds are highly preferable. For example, the text might display green when the load is under 60%, turn yellow at 80%, and flash red when it exceeds 80% of the derated capacity. This intuitive, at-a-glance feedback is the cornerstone of effective Error Reduction on the data center floor.
How Local Digital Indicators Reduce Installation Errors
Looking closely at an actual deployment, having a screen is highly beneficial, but how does it change the physical workflow? Integrating local displays into standard operating procedures transforms a risky guessing game into a precise, step-by-step technical process.
Pre-connection checks and setup steps
Before a technician even unboxes a new server, pre-connection checks must begin. Standard operating procedures should dictate that the technician physically walks to the back of the rack and notes the current draw on both the A and B power feeds. If the local display shows feed A at 14A and feed B at 8A, there is already an imbalance that needs investigating before new hardware is introduced.
Once the baseline is verified, setup steps involve plugging in the primary power supply, watching the local indicator for the inrush current spike, and verifying the new steady-state load. This immediate feedback loop ensures that the addition does not push the branch circuit dangerously close to its breaker limit.
Common error modes: overloads and phase imbalance
Two of the most common error modes in data centers are creeping overloads and phase imbalances. Creeping overloads happen slowly over months; one 1U server at a time is added until a 20A circuit sits precariously at 15.9A. A local indicator flashes a warning, stopping the technician from making a final, overload-triggering connection.
Phase imbalance is arguably trickier. In a 3-phase Wye configuration (such as 120/208V or 230/400V), the load across phases L1, L2, and L3 should ideally be balanced within a 10% to 15% margin. If L1 is carrying 22A while L2 and L3 are barely pulling 5A, upstream UPS capacity is wasted, and there is a risk of a neutral wire overload. A quality local meter displays all three phases simultaneously, guiding the technician to plug the next device into an underutilized phase.
Technician decision points during installation
Throughout an installation, technicians face multiple go/no-go decision points. Should they use outlet bank 1 or bank 2? Is it safe to power on all four nodes of a high-density chassis at once? The local display acts as an immediate, localized supervisor.
Instead of submitting a ticket to the facilities team to check the branch monitoring system—a process that might take hours—technicians can make safe, real-time decisions. This autonomy drastically improves deployment speed while simultaneously locking down safety.
How to Select a Metered PDU for Error Reduction and
Selecting the right gear is not just about picking the highest specifications; it is about matching the hardware to specific operational risks. When evaluating options for a new build-out, IT managers must weigh load visibility against compliance requirements and budget constraints.
Core selection criteria by load and branch monitoring
Core selection criteria start with deciding between aggregate, branch-level, or outlet-level monitoring. For standard 5kW racks, an aggregate meter showing total PDU draw is usually sufficient. However, when deploying high-density AI clusters pulling 15kW to 20kW per rack, branch-circuit monitoring is absolutely necessary.
High-density power strips often utilize 60A inputs broken down into multiple 20A branch circuits, each protected by its own breaker. A local display that can toggle between these specific branches is critical. Without it, a technician might see that the aggregate load is fine (e.g., 30A total on a 60A feed) but fail to realize that all 30A are stacked onto a single, overloaded branch.
Compliance factors: labeling and lockout
Compliance factors are another major driver. In many regions, electrical codes mandate strict labeling and lockout/tagout (LOTO) capabilities. Local displays aid in compliance by providing clear, unambiguous readouts of live power, which is a critical step in verifying zero-energy states during maintenance.
Additionally, look for units rated for high operating temperatures. Modern hot-aisle containment systems routinely push ambient temperatures to 60°C (140°F). If a local indicator’s LCD screen blacks out or fails at 45°C, it becomes useless exactly when it is needed most. Ensuring the display module shares the robust thermal compliance of the PDU chassis is vital for long-term reliability.
Feature trade-offs across PDU tiers
Finally, it is important to evaluate the feature trade-offs across different tiers of power distribution.
| PDU Tier | Local Display? | Remote Network Comm? | Outlet Switching? | Relative Cost |
|---|---|---|---|---|
| Basic | No | No | No | 1.0x (Baseline) |
| Metered | Yes | Yes (Usually) | No | 1.3x – 1.5x |
| Switched | Yes | Yes | Yes | 2.0x – 2.5x |
| Smart/Per-Outlet | Yes (Detailed) | Yes | Optional | 3.0x+ |
As the table shows, jumping from Basic to Metered offers the highest ROI for pure Maintenance Efficiency. Facilities gain the critical local display and usually remote IP monitoring for only a moderate price premium. While switched or per-outlet metered units offer incredible control, they often introduce unnecessary cost and complexity if the primary goal is simply preventing technicians from overloading a circuit.
When to Choose a Metered PDU with a Local Digital
To conclude, organizations need a solid framework to decide when the investment in local digital indicators makes the most sense. Not every single network closet requires a top-tier metered unit, but in the core data center, the math heavily favors visibility.
Decision framework by rack density and site needs
A reliable decision framework relies heavily on rack density and site accessibility. For low-density network racks drawing under 3kW, basic power strips might suffice if the budget is razor-thin. However, the moment a rack crosses the 5kW threshold, the risk profile changes. At 5kW to 10kW, standard metered units become practically mandatory.
When pushing into the 15kW to 30kW high-density territory—common with modern GPU deployments—the margin for error drops to zero. At these densities, a single misplaced 2U server can instantly trip a 30A branch. In these environments, local displays with per-branch granularity are not just nice to have; they are a fundamental safety requirement.
When local indicators deliver the most value
Local indicators deliver the most value in environments with high physical churn. Colocation facilities, managed service providers, and enterprise labs where hardware is constantly being racked, un-racked, and re-cabled see the fastest return on investment.
When multiple hands are in the racks—sometimes from different vendors or departments—facilities cannot rely on tribal knowledge or centralized DCIM software that might be a week out of date. The local display serves as the single source of truth. It communicates the immediate, undeniable reality of the power draw, empowering technicians to work quickly, confidently, and safely without bringing the rest of the infrastructure down.
Key Takeaways
- The most important conclusions and rationale for Metered PDU
- Specs, compliance, and risk checks worth validating before you commit
- Practical next steps and caveats readers can apply immediately
Frequently Asked Questions
Why is a local digital indicator important on a metered PDU?
It shows real-time load at the rack, so technicians can verify capacity before plugging in equipment and avoid breaker trips during installs or MACs.
What should a metered PDU display show to reduce human error?
Look for clear readings of amps, volts, kW, and per-phase load, plus visible overload alarms. These values help staff make fast, safe rack-level decisions.
How does a metered PDU help with the 80% circuit loading rule?
On a 30A circuit, the safe continuous load is typically 24A. The local display lets technicians compare live current to that limit before adding servers.
Can a metered PDU help balance loads in 3-phase racks?
Yes. Per-phase current readings show whether one phase is overloaded, helping teams place new devices on the right phase and reduce failover risk.
Where can I compare metered PDU options for rack power visibility?
You can review rack-level metered PDU models and specs at yosunpdu.com to compare display features, outlet layouts, and monitoring capabilities.
Post time: May-25-2026


